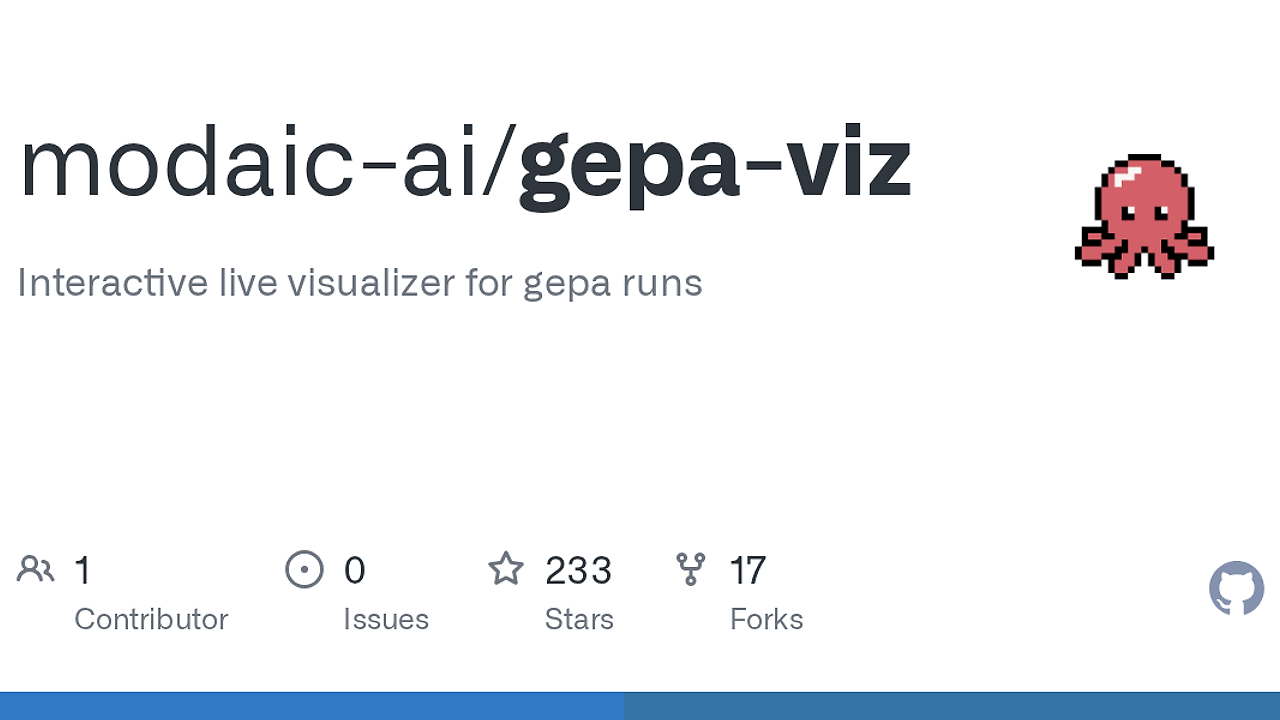
What Is gepa-viz?
gepa-viz is one of the best Prompt Optimization Tools for devs tuning GEPA/DSPy prompt loops. Built by the modaic-ai GitHub repository, it visualizes prompt-optimization runs as a live candidate tree and ships three modes: embedded, remote, and static. It is aimed at engineers who need to inspect why a prompt was accepted, rejected, or reflected on instead of reading opaque JSON dumps.
Quick Overview
| Attribute | Details |
|---|---|
| Type | Prompt Optimization Tools |
| Best For | devs tuning GEPA/DSPy prompt loops |
| Language/Stack | Python callback + CLI, bundled React/Vite/D3/Tailwind SPA, SSE streaming, stdlib ThreadingHTTPServer |
| License | MIT |
| GitHub Stars | N/A as of Feb 2026 |
| Pricing | Open-Source |
| Last Release | N/A — date not exposed on the page |
Who Should Use gepa-viz?
- DSPy users running
GEPAcompiles who need to see which prompt variants actually improved minibatch scores before the optimizer commits a valset evaluation. - Prompt engineers comparing candidate prompts across a pareto frontier and needing per-example green/red feedback instead of a single aggregate number.
- ML platform teams that want a lightweight local viewer with no Node runtime, no hosted SaaS dependency, and a plain
run.jsonartifact for sharing runs. - Indie hackers building prompt workflows who want a visual debugger they can pip-install, run locally, and archive in CI.
Not ideal for:
- Teams looking for a broad observability suite across app traces, API spans, and model calls; gepa-viz is specialized around GEPA runs.
- Users who only want a spreadsheet-style score table and do not care about graph topology, parent-child diffs, or reflection feedback.
- Organizations that require a centrally managed multi-tenant SaaS with RBAC, audit logs, and SSO out of the box.
Key Features of gepa-viz
- Live candidate-tree rendering — The SPA draws accepted and rejected proposals as a force-directed graph, so you can see the search process evolve node-by-node instead of reading a static report.
- Per-example score rings — Accepted candidates are rendered as donut nodes whose ring segments are green or red per validation example, which makes trade-offs across examples visible at a glance.
- Node detail inspector — Clicking any node opens the candidate prompt, the prompt diff against its parent, the reflection minibatch, and a clickable pixel-grid view of the pareto frontier.
- Rejected-node introspection — Small grey nodes still carry hoverable feedback, so you can inspect why a minibatch retry failed and why the candidate never reached the valset.
- Streaming over SSE — In live mode, snapshots are POSTed to
/ingestand pushed to browsers over Server-Sent Events, which keeps the UI updating without polling or websocket setup. - No Node runtime for end users — The published wheel ships the prebuilt SPA inside
gepa_viz/static/, and the viewer server is a tiny stdlibThreadingHTTPServer, so installation stayspip install gepa-viz. - Three execution modes — Embedded mode runs its own viewer, remote mode streams to a standalone server, and static mode writes
run.jsonfor later inspection in CI or offline debugging.
gepa-viz vs Alternatives
| Tool | Best For | Key Differentiator | Pricing |
|---|---|---|---|
| gepa-viz | GEPA prompt-optimization runs | Purpose-built candidate-tree and pareto-frontier visualization | Open-Source |
| Promptfoo | Prompt regression testing | Strong evaluation harness and assertions for prompt outputs | Open-Source |
| LangSmith | Production LLM tracing | Broader observability across chains, traces, and datasets | Freemium |
| OpenTrace | Request and model-call tracing | Generic trace inspection outside the GEPA workflow | Open-Source |
Pick gepa-viz when the problem is specifically prompt search and you need to see accepted versus rejected candidates, minibatch reflections, and per-example scoring in one place. Pick OpenTrace when you need a wider trace timeline across requests or tool calls rather than a GEPA-specific optimizer view.
Choose Promptfoo when you want regression tests, assertions, and batch evaluation pipelines around prompts. Choose LangSmith when you already run a broader LangChain-style observability stack and want hosted trace storage more than a local visualization focused on pareto-frontier movement.
If you generate candidate prompts before optimization, Brainstorm MCP can sit upstream of gepa-viz as an ideation layer. If you are orchestrating multiple autonomous runs, OpenSwarm is the better place to manage coordination, while gepa-viz stays focused on one run’s candidate evolution.
How gepa-viz Works
gepa-viz is built around a simple data model: examples plus a candidates map keyed by candidate IDs. Accepted candidates use integer IDs like 0 and 1, while rejected children use parent-scoped IDs like 0.1, which preserves the optimization tree and makes ancestry trivial to reconstruct.
The Python side is a callback wrapper named GepaVizCallback. In embedded mode it starts a local server, opens a browser tab, streams snapshots as the optimizer runs, and writes a final run.json when the context manager exits; in remote mode it sends those snapshots to /ingest on a separate server, and in static mode it only persists the artifact for later viewing.
The frontend is a Vite SPA backed by React, D3, and Tailwind. The graph view emphasizes search dynamics rather than generic dashboards, so the layout prioritizes ancestry, score distribution, and candidate acceptance over dense tables or charts.
gepa-viz live --host 0.0.0.0 --port 5151
That command starts the standalone viewer and exposes the ingest endpoint for remote producers. Once a run posts snapshots, the browser updates over SSE and the graph grows as candidates are accepted or rejected.
Pros and Cons of gepa-viz
Pros:
- No hosted dependency — you can run the viewer locally, on a build box, or on a remote machine with plain HTTP.
- Fast mental model — the graph shows lineage, acceptance, and failure reasons in one structure, which is easier to debug than raw logs.
- Artifact-first workflow —
run.jsongives you a shareable, inspectable snapshot that survives the process that created it. - Works with both GEPA flavors — the page shows usage with DSPy and base
gepa, so it fits more than one integration path. - Low installation friction — the published package includes the SPA, so end users do not need to build the frontend themselves.
Cons:
- Narrow scope — gepa-viz is tightly centered on GEPA optimization runs, so it will not replace a general observability platform.
- Local-first UI — there is no obvious multi-user SaaS layer, role management, or centralized project sharing in the page text.
- Runtime requirement for live mode — the embedded viewer keeps a process alive until you stop it, which is fine for development but less convenient for ephemeral jobs.
- Graph-heavy interface — if you only need scores, prompts, and diffs, the visualization may be more than you want.
Getting Started with gepa-viz
Install the package and run a live viewer or a static dump depending on your workflow. For a local interactive session, start with the package install, then wire the callback into your optimizer.
pip install gepa-viz
gepa-viz serve --file run.json
from gepa_viz import GepaVizCallback

with GepaVizCallback(valset=valset, trainset=trainset) as cb:
    gepa.optimize(..., callbacks=[cb])
After you run that, gepa-viz writes run.json and serves the viewer from the local machine. If you are testing in CI or on a headless worker, switch to live=False and reuse the static file with gepa-viz serve --file run.json.
Verdict
gepa-viz is the strongest option for inspecting GEPA prompt-optimization runs when you need live candidate-tree visibility and zero Node dependency. Its biggest strength is making reflection, rejection, and pareto decisions readable in real time; its main caveat is that it is specialized, not a general observability suite. Use it if GEPA is your optimizer and debugging the search path matters.