Claude Code Canvas: What It Kills / Replaces
This tool competes against conventional session logging tools by providing a visual and interactive format. It aims to streamline how developers interact with Claude Code sessions, moving away from linear logs.
Under the Hood: Architecture / Protocol / Core Mechanic
Built on Node.js, the backend reads session history data from ~/.claude/history.jsonl and per-session JSONL files under ~/.claude/projects/. The browser retrieves this data to create a radial layout, displaying sessions graphically on an HTML5 Canvas using hardware-accelerated rendering.
The Good & The Bad
Pros:
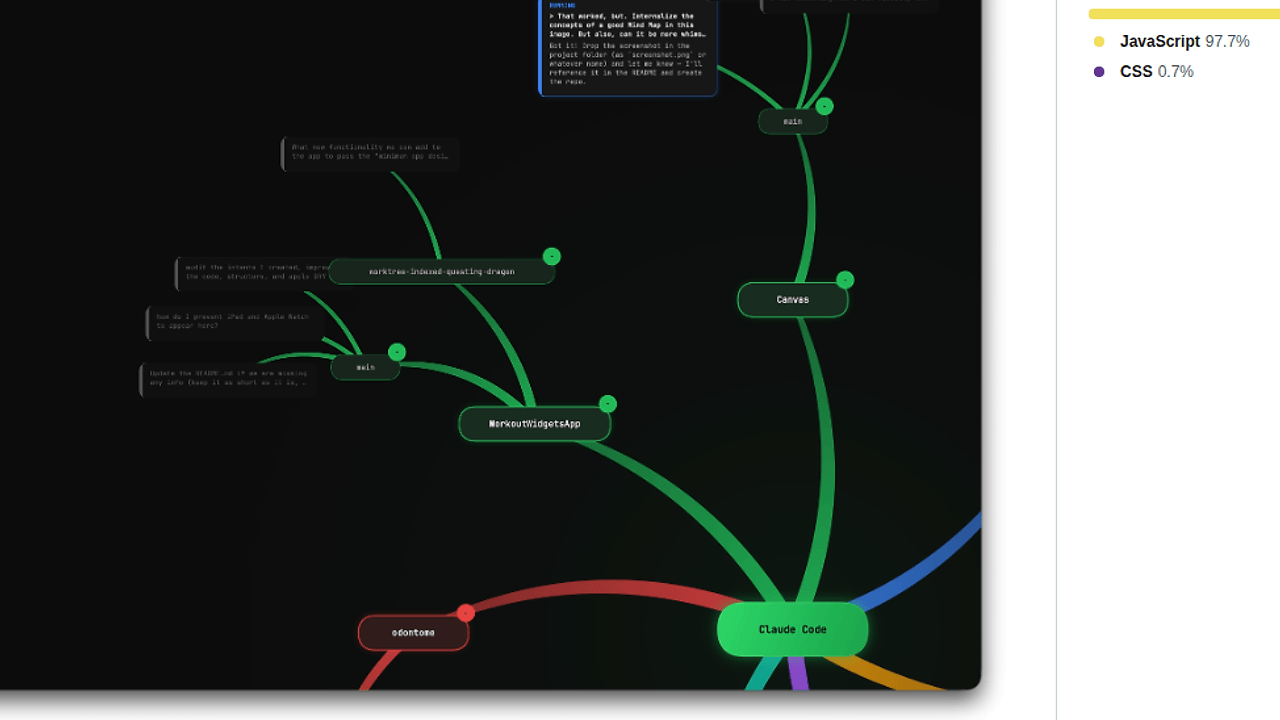
- Provides an intuitive radial mind map for easier visualization.
- Supports live updates, polling for new data every 5 seconds.
- Offers drag-and-drop functionality for organizing session layouts.
- Can collapse/expand project branches, simplifying complex session navigation.
Cons:
- Limited to environments with Node.js installed; not all users may have it setup.
- Heavily relies on local file formats like JSONL which could be a barrier for those unfamiliar.
- The performance could degrade with a large number of sessions in the visualization.
Quickstart
To get started, simply install the dependencies and run the application:
npm install
npm start
Then navigate to http://localhost:3000 to visualize your sessions.