What Is Claude Code Usage Dashboard?
Claude Code Usage Dashboard is one of the best AI Coding Analytics tools for Claude Code users. Built by The Product Compass Newsletter, it reads local Claude Code JSONL logs and turns them into token charts, session history, and cost estimates for API, Pro, and Max plans, with auto-refresh every 30 seconds and zero third-party dependencies. It is for developers who want exact usage data instead of Anthropic’s partial in-app view.
Quick Overview
| Attribute | Details |
|---|---|
| Type | AI Coding Analytics |
| Best For | Claude Code users, Pro/Max subscribers, and API-heavy teams |
| Language/Stack | Python 3.8+, SQLite, JSONL, stdlib http.server, Chart.js |
| License | MIT |
| GitHub Stars | N/A as of Apr 2026 |
| Pricing | Open-Source |
| Last Release | N/A |
Who Should Use Claude Code Usage Dashboard?
- Solo developers who want a local audit trail for Claude Code sessions, token counts, and model mix without shipping usage data to a SaaS.
- Indie hackers tracking prompt spend across experiments who need a fast way to see which projects burn through
claude-sonnet-4-6versusclaude-haiku-4-5. - Platform engineers who need a lightweight way to inspect usage patterns from the terminal before wiring metrics into a broader observability stack.
- Xcode and VS Code users who rely on Claude Code inside editors and want those sessions visible in one SQLite-backed history.
Not ideal for:
- Teams that need centralized, multi-user billing dashboards with permissions and audit controls.
- Users who only run Cowork sessions, since those do not emit the local JSONL transcripts this tool reads.
- People who want a hosted web app instead of a local-first CLI plus browser dashboard workflow.
Key Features of Claude Code Usage Dashboard
- Local JSONL ingestion — The scanner reads Claude Code session files from
~/.claude/projects/and the Xcode Claude integration path when it exists. That means the dashboard works from the logs Claude already writes, with no agent install step. - Incremental database updates — Re-running
python cli.py scanis fast because the scanner tracks each file path and modification time. Only new or changed transcripts are processed, which matters when your project directory accumulates hundreds of sessions. - SQLite-backed storage — Usage data lands in
~/.claude/usage.db, so history survives browser restarts and shell exits. SQLite is a good fit here because the data model is append-heavy, local, and easy to query from the terminal. - Per-model token breakdown — The parser extracts
input_tokens,output_tokens,cache_creation_input_tokens,cache_read_input_tokens, andmessage.modelfrom assistant records. That gives you a real view of prompt cache behavior and output cost, not just a rough session total. - Cost estimation by model family — Claude Code Usage Dashboard applies Anthropic API pricing as of April 2026 and only prices models whose names contain
opus,sonnet, orhaiku. Unknown or local model names stay out of the calculation and show up asn/a, which keeps the math conservative. - Browser dashboard with Chart.js — The
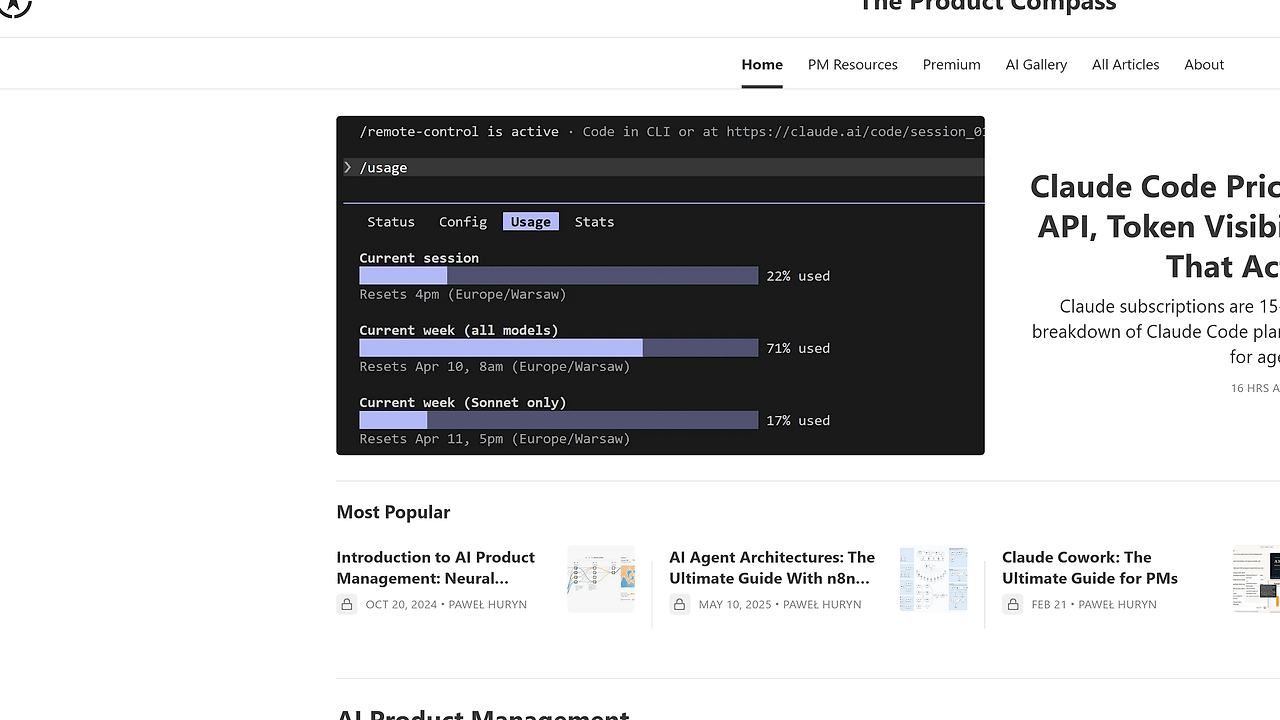
dashboardcommand serves a single-page UI onlocalhost:8080and loads Chart.js from a CDN. It auto-refreshes every 30 seconds and supports model filters with bookmarkable URLs, so you can share a stable view of one model or project. - Terminal-first commands —
scan,today,stats, anddashboardcover the main workflows without forcing you into the browser. That makes the tool useful both as a quick shell utility and as a small local analytics service.
Claude Code Usage Dashboard vs Alternatives
| Tool | Best For | Key Differentiator | Pricing |
|---|---|---|---|
| Claude Code Usage Dashboard | Local Claude Code spend and token tracking | Reads local JSONL logs into SQLite and estimates cost per model | Open-Source |
| OpenTrace | Distributed tracing and request observability | Better when you need service-level traces instead of agent-session accounting | N/A |
| DataHaven | Broader data collection and analytics workflows | Better if you need a generalized data layer, not a single-purpose usage dashboard | N/A |
| Anthropic UI | Built-in Claude usage glance | Convenient, but it does not expose the same local transcript detail or SQLite history | Included with plan |
Pick Claude Code Usage Dashboard when you care about local source-of-truth data, especially per-session token counts and cache reads. Pick OpenTrace when your problem is tracing distributed systems rather than Claude usage, and pick DataHaven when you need a wider analytics pipeline around your data.
If you already use Anthropic’s built-in UI, this tool still adds value because it reconstructs usage from local files and lets you query historical data from the terminal. That makes it a better fit for developers who want reproducible numbers and offline access.
How Claude Code Usage Dashboard Works
Claude Code Usage Dashboard uses a simple local-first architecture: Claude Code writes one JSONL transcript per session, the scanner parses those files, and SQLite stores the normalized records. The main abstraction is the assistant record, which carries token usage and model metadata, so the dashboard can aggregate by model, session, project, or day without re-reading every transcript on each page load.
The design is intentionally small. scanner.py handles ingestion, dashboard.py serves the browser UI, and cli.py wires the commands together, which keeps the codebase easy to audit and easy to fork. The dashboard is not a cloud service, so the only data movement happens between local files, the SQLite database, and your browser.
python cli.py scan
python cli.py dashboard
The first command populates ~/.claude/usage.db from the transcript files already on disk. The second command starts the local web server, opens the dashboard, and lets you filter usage by model while the page refreshes every 30 seconds.
Pros and Cons of Claude Code Usage Dashboard
Pros:
- No dependency sprawl — It uses only the Python standard library plus Chart.js from a CDN, so setup is trivial and failure modes are limited.
- Local data ownership — Logs stay on disk in JSONL and SQLite, which is easier to inspect, back up, and script against than a closed dashboard.
- Incremental scanning — File path plus modification-time tracking avoids reprocessing unchanged sessions, which keeps repeated scans fast.
- Useful cost math — It translates token counts into estimated spend using explicit Anthropic API pricing, which is better than guessing from raw tokens alone.
- Cross-surface coverage — It captures Claude Code CLI, VS Code extension, and dispatched sessions, so usage does not disappear when you switch entry points.
Cons:
- Local-only scope — It does not centralize data across a team, so it is not a substitute for an org-wide billing or governance system.
- Limited session coverage — Cowork sessions are excluded because they do not write local JSONL transcripts.
- No hosted backend — If you want remote access, sharing, or role-based access control, you need to build that yourself.
- Pricing assumptions are API-based — Pro and Max subscribers get a different real-world cost structure, so the estimate is informational rather than a billing statement.
- Browser UI is lightweight — The dashboard is practical, not fancy, and it is intentionally narrower than a full observability product.
Getting Started with Claude Code Usage Dashboard
git clone https://github.com/phuryn/claude-usage
cd claude-usage
python cli.py dashboard
On macOS and Linux, replace python with python3. After the scan runs, the tool creates or updates ~/.claude/usage.db, then serves the dashboard on localhost:8080 with your recent Claude Code sessions already indexed. If you keep transcripts in a nonstandard location, run python cli.py scan --projects-dir /path/to/transcripts first.
Verdict
Claude Code Usage Dashboard is the strongest option for local Claude Code spend tracking when you want zero-dependency setup and offline storage. Its best strength is accurate per-model token accounting from existing JSONL logs, and its main caveat is that it stays local by design. Use it if you want hard numbers without a SaaS layer.