What Is CodeBurn?
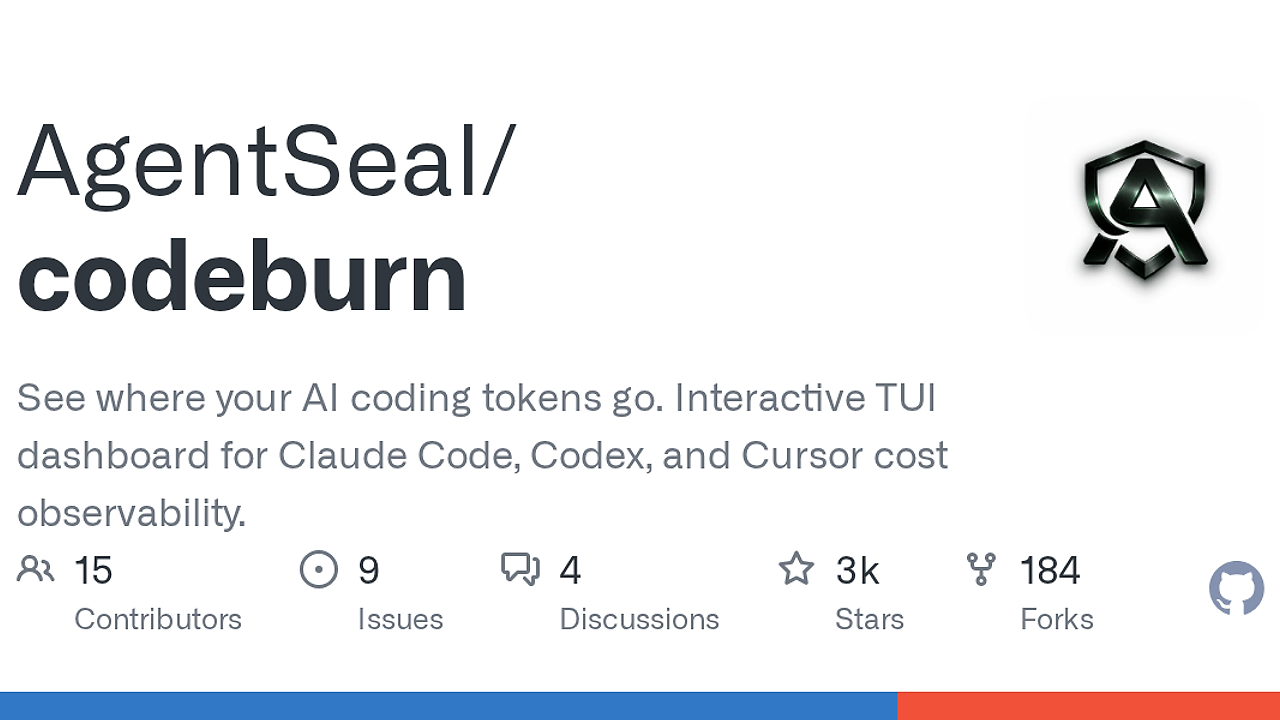
CodeBurn is an open-source AI coding analytics CLI built by AgentSeal for developers, indie hackers, and CTOs who use Claude Code, Codex, Cursor, OpenCode, Pi, or GitHub Copilot, and it reads local session data to show where assistant tokens and retries go. CodeBurn is one of the best AI Coding Analytics tools for developers, indie hackers, and CTOs who run local AI assistants, and the repo documents six supported providers, Node.js 20+ support, and 162 supported currency codes for cost conversion.
Quick Overview
| Attribute | Details |
|---|---|
| Type | AI Coding Analytics |
| Best For | developers, indie hackers, and CTOs using AI coding assistants |
| Language/Stack | Node.js 20+, TypeScript, local SQLite, JSONL session files, TUI |
| License | N/A |
| GitHub Stars | N/A as of Feb 2026 |
| Pricing | Open-Source |
| Last Release | N/A |
Who Should Use CodeBurn?
- Solo founders shipping with Claude Code or Cursor who need a hard cost readout without setting up telemetry infra.
- Platform and engineering leads who want to identify which projects, models, and MCP servers are driving token waste across the team.
- Agent-heavy devs who need one-shot success rates for edit, test, and fix loops so they can spot retry storms.
- Power users on mixed providers who want one dashboard for Claude Code, Codex, Cursor, OpenCode, Pi, and GitHub Copilot.
Not ideal for:
- Teams that want server-side billing analytics from a centralized SaaS instead of local session inspection.
- Users who do not keep session data on disk in one of the supported provider locations.
- GitHub Copilot users who need exact prompt-token accounting, because CodeBurn only sees output tokens there.
Key Features of CodeBurn
- Disk-native session ingestion — CodeBurn reads provider sessions directly from local files and databases, so there is no wrapper process, proxy, or API key to manage. That design keeps it offline-first and avoids instrumenting your editor or shell.
- Provider plugin system — The repo says adding a provider is a single-file job that handles session discovery, JSONL parsing, tool normalization, and model display names. That matters if your team wants to extend CodeBurn for Amp or another internal agent.
- Cross-provider normalization — CodeBurn maps provider-specific tool names to a shared vocabulary, such as translating Codex
exec_commandintoBashandread_fileintoRead. That makes the tool breakdown comparable across Claude Code, Codex, and the rest of the stack. - One-shot success metrics — The dashboard tracks whether an activity succeeds on the first attempt or burns extra tokens through edit, test, and fix retries. That metric is more useful than raw token totals when you are optimizing agent prompts or debugging a flaky workflow.
- Interactive TUI dashboard — Arrow-key navigation, gradient charts, responsive panels, and quick switches between Today, 7 Days, 30 Days, Month, and All Time make CodeBurn usable in a terminal without exporting to a spreadsheet first. The dashboard also surfaces average cost per session and the five most expensive sessions.
- Structured export paths —
report,today, andmonthsupport--format json, whileexportcan emit CSV or JSON. That makes CodeBurn easy to pipe intojq, store in CI artifacts, or feed into another analytics layer. - Pricing and currency support — CodeBurn prices models through LiteLLM rate tables, which are auto-cached so it can estimate costs without calling a billing API. The repo says 162 ISO 4217 currencies are available, which is useful if your finance team does not think in USD.
CodeBurn vs Alternatives
| Tool | Best For | Key Differentiator | Pricing |
|---|---|---|---|
| CodeBurn | Local AI assistant cost and retry audits | Reads session data from disk and normalizes multiple providers | Open-Source |
| WakaTime | General coding time tracking | Measures editor time and language activity, not AI token burn | Freemium |
| OpenTrace | LLM and agent tracing | Captures traces, spans, and prompt flow instead of local session exports | N/A |
| Claude Context Mode | Prompt control for Claude workflows | Helps shape assistant behavior before a run, while CodeBurn measures the spend after it | N/A |
Pick WakaTime when you care about time spent in the editor, not how many retry loops your agent needed. Pick OpenTrace when you need request-level observability across services or agent calls instead of local session accounting.
Pick Claude Context Mode when you want to control Claude behavior up front. Pick OpenSwarm when the problem is orchestration and parallel work distribution; keep CodeBurn for the post-run cost audit.
How CodeBurn Works
CodeBurn uses a local-first pipeline: discover sessions, parse provider-specific formats, normalize tool names, aggregate usage by model and project, then render the dashboard or structured export. The core abstraction is not an API call, it is the session file or SQLite record already written by each provider, which is why CodeBurn can work without auth setup.
The architecture is intentionally adapter-driven. Claude Code and Codex appear as session files, Cursor and OpenCode can be read from SQLite, and each provider adapter is responsible for locating data, decoding it, and translating the event stream into a shared usage schema. That shared schema powers the cost panels, project summaries, activity classifier, core tool breakdown, MCP server view, and shell-command analysis.
A practical workflow looks like this:
codeburn report --provider claude --project myapp --format json | jq '.overview, .projects[:3]'
That command loads Claude Code sessions from disk, filters them to one project, and prints normalized JSON so you can inspect spend or hand the output to automation. If the provider database is large, especially for Cursor, the first scan can take longer because CodeBurn builds its cache before later runs become near-instant.
Pros and Cons of CodeBurn
Pros:
- No proxy layer — CodeBurn stays out of the request path, so there is no latency tax or need to modify your IDE integration.
- Multi-provider coverage — One CLI can inspect Claude Code, Codex, Cursor, OpenCode, Pi, and GitHub Copilot sessions from their native storage locations.
- Actionable retry analysis — The one-shot success rate makes it obvious when prompts, tools, or project constraints are causing waste.
- Good automation surface — JSON output, CSV export, project filters, and provider filters make the data easy to automate.
- Offline-friendly — Because it reads local state, CodeBurn works even when APIs are rate-limited or unavailable.
- Cost localization — Currency switching and cached FX rates are useful if your finance team does not think in USD.
Cons:
- Local data only — If a provider does not keep sessions on disk, CodeBurn cannot see it.
- Copilot limitations — GitHub Copilot support only tracks output tokens, so the accounting is less complete than for providers with full session logs.
- Cursor first-run cost — Large Cursor databases can take up to a minute on the first scan before caching kicks in.
- Estimate-based pricing for some modes — Cursor Auto mode uses Sonnet pricing estimates, which are useful but not identical to the hidden model choice.
- Terminal-first UX — The TUI is good for engineers, but non-technical stakeholders may prefer a web dashboard or SaaS report.
Getting Started with CodeBurn
npm install -g codeburn
codeburn
codeburn report --format json | jq '.overview'
codeburn optimize
That installs the CLI globally, opens the interactive dashboard, and then shows how to pull structured data or scan for waste. On first run, CodeBurn detects whichever supported providers already have local session data, and Cursor/OpenCode users may see a short indexing pass while the cache is built.
If you do not want a global install, npx codeburn works too. After that, use codeburn report --provider claude, codeburn today, or codeburn export -f json to wire the data into shell scripts, CI artifacts, or a personal cost review flow.
Verdict
CodeBurn is the strongest option for local AI usage accounting when your assistants already write sessions to disk. Its biggest strength is provider-agnostic normalization across Claude Code, Codex, Cursor, OpenCode, Pi, and Copilot, while the main caveat is that it cannot see cloud-only activity. If you want hard numbers without SaaS lock-in, CodeBurn is the right default.